An operating screen, not just a wall of alerts
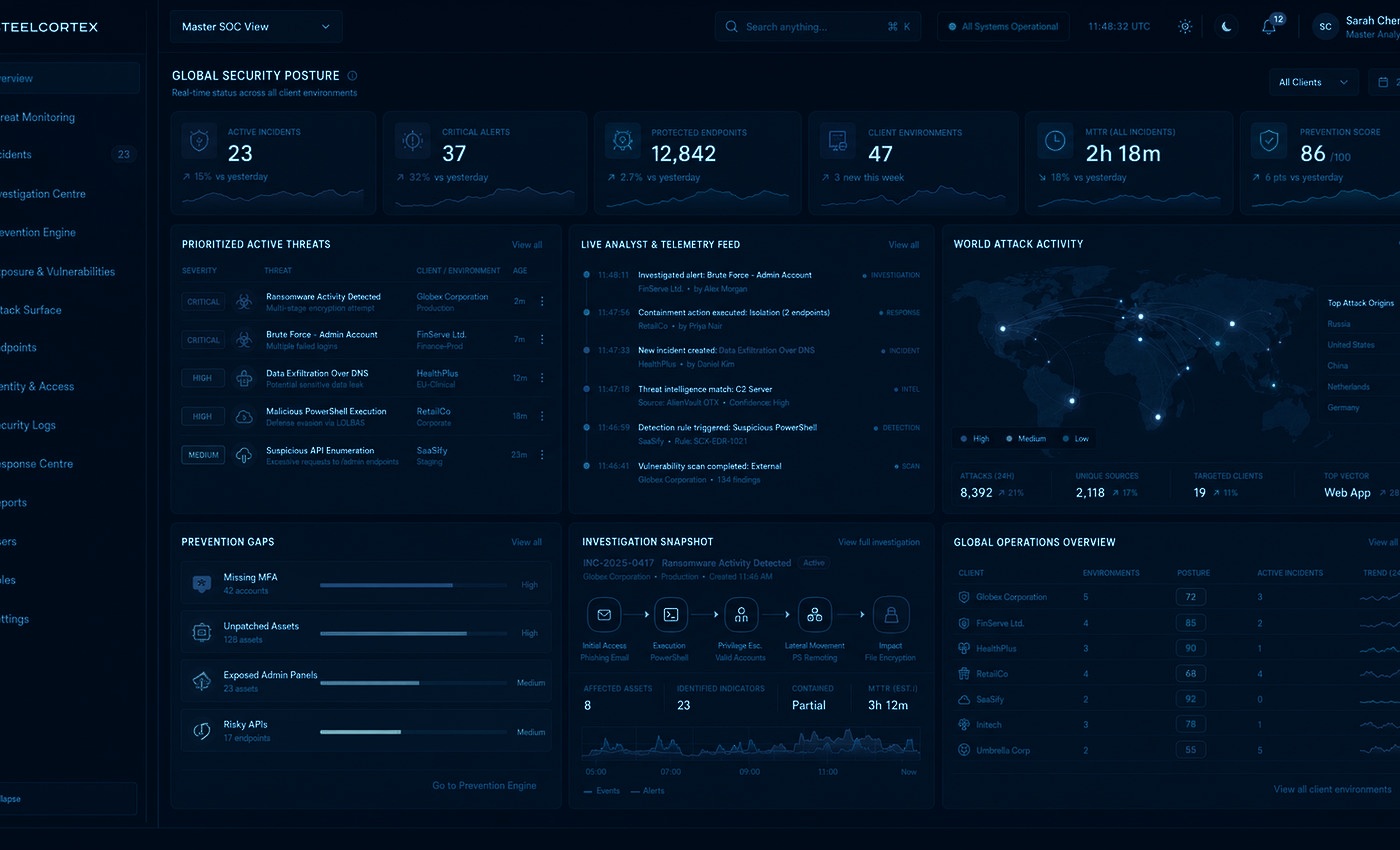
The SteelCortex SOC Dashboard is designed to show what needs attention now, what is being investigated, what remains exposed and whether remediation is reducing risk. The purpose is to help analysts and managers make decisions without forcing them to reconstruct the security picture from multiple disconnected tools.
Key dashboard views
- Active incidents and high-priority alerts.
- External attack-surface and vulnerability exposure.
- Protected assets, identities and monitored environments.
- Investigation status and evidence progress.
- Remediation actions, ownership and overdue items.
- Cloud, identity and data-risk indicators.
- Management metrics and reporting trends.
Prioritisation
Counts alone can be misleading. A dashboard should help distinguish an isolated low-impact alert from a smaller number of events connected to critical assets or realistic attack paths. SteelCortex therefore aims to add asset importance, exposure and investigation context to the security signal.
Different users, different views
Analysts need operational detail, managers need workload and risk visibility, and executives need a concise explanation of material exposure and progress. Client-specific views can therefore present the same underlying evidence at the level appropriate to the user’s role.
From dashboard to action
Important items should lead directly into investigation, remediation or reporting rather than end as a coloured status tile. The dashboard acts as the entry point to the wider SteelCortex workflow.